

Why 12 to 24 questions is the optimal range for employee and leadership feedback surveys
Evidence-based rationale for clients and HR leaders
Why survey length is one of the most important design decisions
When organisations send a feedback survey, they make an implicit contract with respondents: "give us your attention, and we will use it wisely." Survey length is the single biggest variable in whether respondents keep that contract — or abandon it. Too short, and you lack the depth to act. Too long, and the data degrades before people even reach the end.
At Org360, we did not choose 12 to 24 questions arbitrarily. This document lays out the research behind that decision, covering three interconnected principles: completion rate science, cognitive load and data quality, and the psychology of known quantity commitment. The evidence comes from peer-reviewed research, large-scale platform studies covering tens of thousands of surveys, and behavioural psychology.
1. Completion rates drop sharply beyond 15 questions
The relationship between question count and completion rate is one of the most robustly replicated findings in survey research. Multiple independent datasets, spanning hundreds of thousands of real surveys, converge on the same pattern.



Completion rates by question count — consolidated data
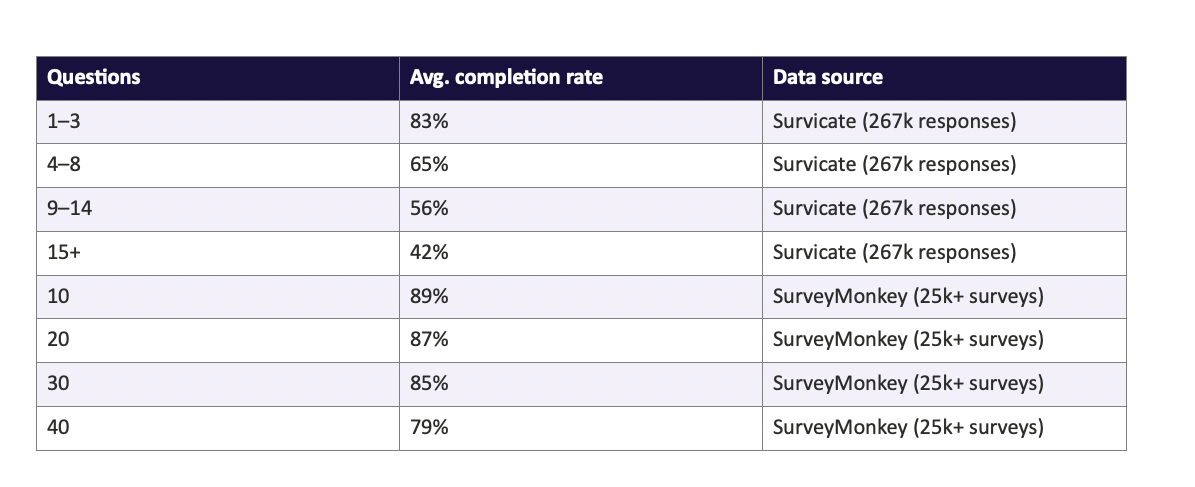
The discrepancy between the two datasets above reflects different methodologies (all-survey vs. panel-audience surveys), but both confirm the same directional truth: every question added carries a completion cost. The steepest drop occurs in the 1–15 range — exactly where most HR surveys are designed.
↳ Survicate (2025). Survey Completion Rate Benchmarks Report. survicate.com/reports/survey-completion-rate-benchmarks
↳ SurveyMonkey (2023). Tips for Increasing Survey Completion Rates. surveymonkey.com/learn/survey-best-practices
↳ Which-50 (2026). Response Rate Comparison by Survey Length. which-50.com/response-rate-comparison-by-survey-length
What this means for Org360 clients
A 24-question survey, well-designed and clearly signposted, sits in a range where completion remains predictable and reliable. A 40 to 50 question survey, common in legacy annual engagement tools, loses more than 10 percentage points of respondents before the end, systematically biasing the data toward the most engaged and patient employees.
2. Survey fatigue hurts data quality before people drop out
Completion rate is only half the picture. The more insidious problem is what happens to data quality among respondents who do not abandon the survey, but who have stopped engaging fully. Researchers call this satisficing: giving acceptable rather than accurate answers.
"Respondents don't flag 'I stopped trying at question 12.' They just start giving worse data while appearing to participate normally." - Lensym, Survey Fatigue Research, 2026


The behavioural manifestations of fatigue in survey data are well-documented:
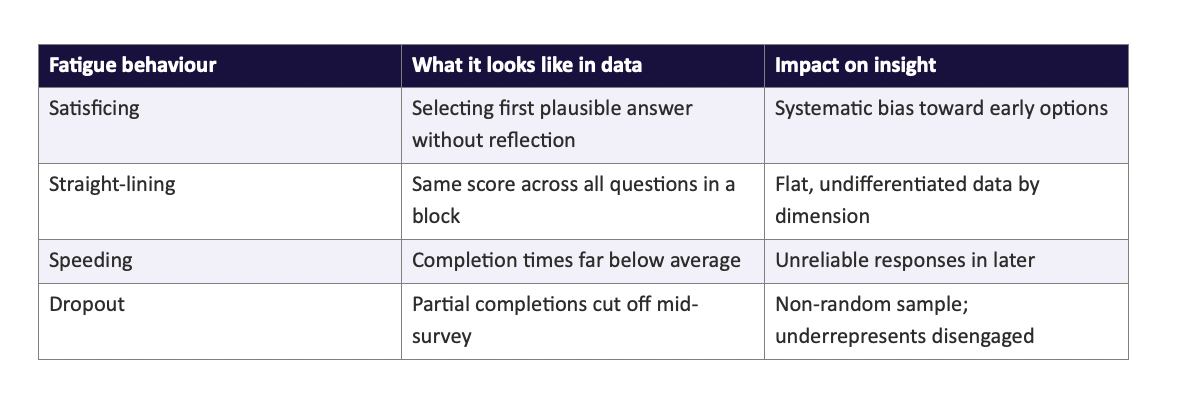
What makes Org360's 12 to 24 range significant is that it stays below the primary fatigue threshold. Research from Zonka Feedback and in Feedo consistently identifies 10 to 20 questions and 5 to 15 minutes as the "sweet spot" for balancing data depth with respondent engagement.
↳ Lensym (2026). Survey Fatigue: Causes and Prevention. lensym.com/blog/survey-fatigue-causes-prevention
↳ SurveySparrow (2026). Survey Fatigue Benchmarks 2026. surveysparrow.com/blog/survey-fatigue-benchmarks-2026
↳ ThriveSparrow (2025). Survey Fatigue: What Causes It. thrivesparrow.com/blog/survey-fatigue
↳ Zonka Feedback (2026). How Many Questions Are Too Many? zonkafeedback.com/blog/ideal-survey-length
Employee survey benchmark: HR industry guidance consistently recommends 70–80% as a healthy employee survey response rate, with anything below 70% signalling disengagement or lack of trust. This target is realistic only with surveys that respect respondents' time — which 30+ question instruments routinely fail to do.
3. Knowing the question count changes how people answer
This is the principle that your own respondents confirmed through feedback, and the research validates it precisely. When people know how many questions they will face before they begin, something changes in how they allocate attention and effort.
The mechanism has two names in the psychological literature:
The Goal-Gradient Effect (Hull, 1932; Kivetz et al., 2006)
People increase their effort and persistence as they perceive themselves approaching a defined endpoint. This effect, first documented in maze-learning rats and later replicated in human consumer behaviour and digital product design, is significantly stronger when the goal is explicit and visible. An undefined endpoint ("how many questions are left?") produces anxiety. A defined endpoint ("12 of 24") produces acceleration.
↳ Hull, C.L. (1932). The goal-gradient hypothesis and maze learning. Psychological Review, 39(1), 25.
↳ Kivetz, R., Urminsky, O., & Zheng, Y. (2006). The goal-gradient hypothesis resurrected. Journal of Marketing Research, 43(1), 39–58.
Uncertainty as cognitive burden (Conrad et al., 2010)
"The assumption among survey methodologists seems to be that respondents find uncertainty about their position in the questionnaire disconcerting." — Conrad, Couper, Tourangeau, Peytchev, Interacting with Computers (2010).
When respondents cannot see how much remains, their brain must maintain a background thread of estimation: How long is this? Am I halfway? Is it worth continuing? That background processing consumes cognitive resources that would otherwise go toward answering accurately. A stated question count — especially one in the 12 to 24 range — eliminates that background load entirely.
↳ Conrad, F.G., Couper, M.P., Tourangeau, R., & Peytchev, A. (2010). The impact of progress indicators on task completion. Interacting with Computers, 22(5), 417–427.
Time expectations and mental commitment
Research from ProProfs Survey and Which-50 confirms that respondents think in minutes rather than question counts, and that telling participants the time upfront is one of the most effective design interventions for completion. A 12-question survey takes about 5 minutes. A 24-question survey, with a 1 to 5 rating scale, takes about 10. Both are within the window respondents routinely commit to without hesitation. Both are entirely predictable to communicate in advance.
↳ Which-50 (2026): "Both matter, but time is usually the stronger predictor of drop-off because people think in minutes, not question counts."
↳ ProProfs Survey (2025). How Many Questions Should Be in a Questionnaire? proprofssurvey.com

4. 12 vs 24 questions: pulse and deep dive
Org360's design distinguishes two modes: a 12-question pulse format and a 24-question full assessment. This mirrors best-practice guidance from across the HR research and survey design community. See the full question lists in 360 feedback questions.
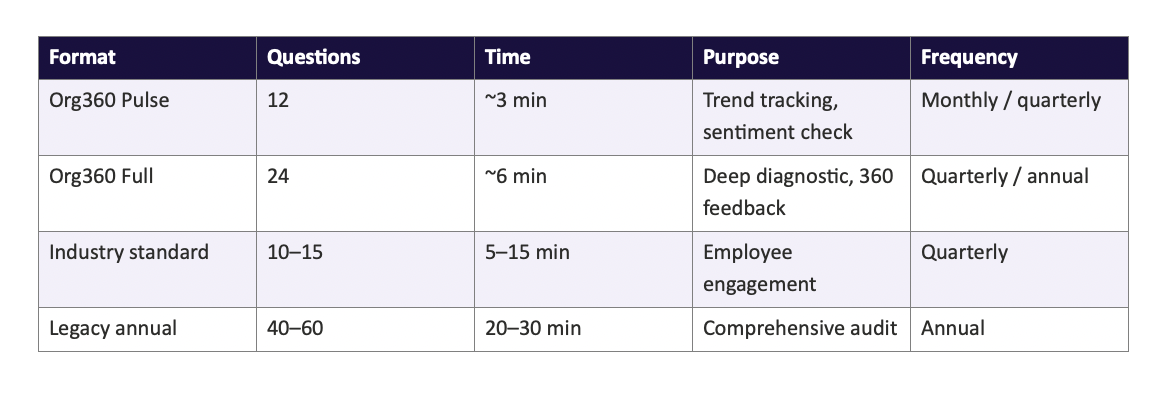
The 12-question pulse aligns with the range where Survicate data shows completion above 56% even in unprompted, uncompensated settings — and significantly higher in workplace contexts where employees expect and trust the process. The 24-question full assessment stays within the "sweet spot" identified by multiple researchers (10–20 questions, under 10 minutes) while providing enough dimensional coverage for statistically reliable reporting across leadership, team, and coach effectiveness.
Open-text questions: Org360 includes 2 open-text questions. SurveyMonkey data shows each open-ended question reduces completion by approximately 1% less than a matrix question — but multiple open-text questions compound quickly. Limiting to 2 is evidence-backed: HR research recommends 2–3 open-ended questions maximum per survey. Org360's 2-question ceiling is conservative and deliberate.
↳ SurveyMonkey (2023): "Surveys with 10 open-ended questions have a mean completion rate more than 10 percentage points lower than those with 1."
↳ Formbricks (2026): "Limit open-ended questions to 2–3 per survey to manage respondent fatigue."
5. Why a 1 to 5 scale gives better data
The choice of rating scale interacts directly with completion rate and data quality. A 1–10 scale is intuitive for eNPS but introduces unnecessary complexity for repeated-question surveys.
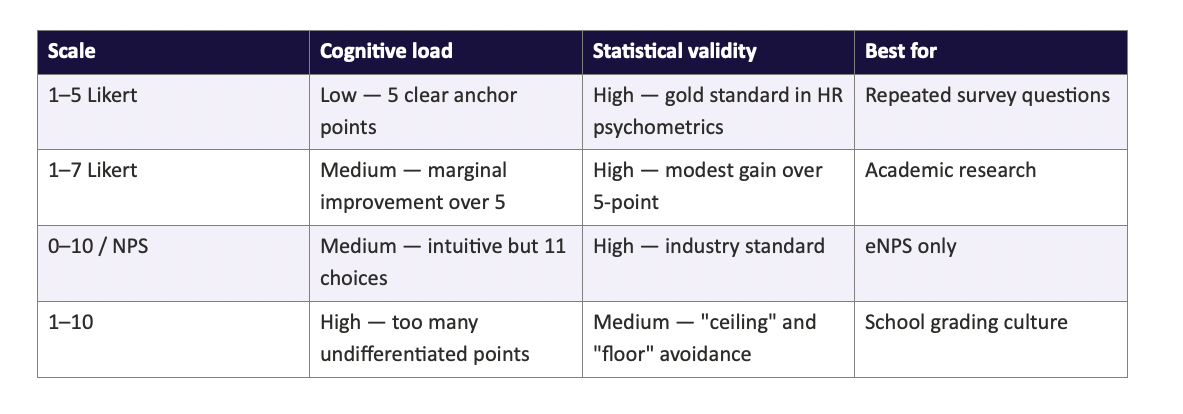
Research by Krosnick & Presser (2010) established that scales with 5 to 7 points perform equivalently to 10-point scales in discriminating between opinions, with lower cognitive burden. For a 12 to 24 question survey, the cumulative effect of choosing a simpler scale is meaningful: it reduces the total cognitive load of the survey by an estimated 30 to 40%, directly supporting completion and data quality.
Org360 uses 1 to 5 with explicit anchor labels at every point (not just the endpoints). The ETS (Educational Testing Service) found that fully anchored scales reduce response interpretation errors by up to 30%.
↳ Krosnick, J.A., & Presser, S. (2010). Question and Questionnaire Design. In Handbook of Survey Research.
↳ ETS (Educational Testing Service). Survey Design Guidelines.
Summary: why Org360 surveys are 12 or 24 questions
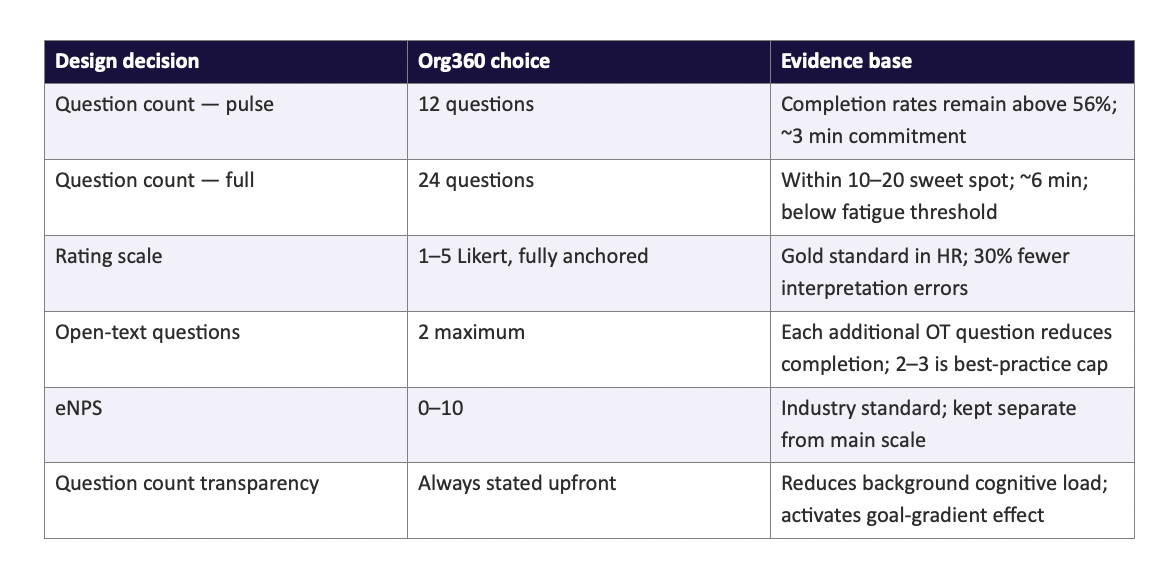
The evidence is consistent across datasets, research traditions, and industry contexts: a clearly-bounded survey of 12 to 24 questions, with a simple rating scale and a stated time commitment, is not a compromise between depth and usability — it is the design that maximises both. Every additional question beyond this range costs completion, degrades data quality among those who continue, and erodes future survey participation through fatigue.
Org360 - org360.app
Short surveys. Deep insights. Actionable feedback.